Fieldwork → Systems
Mapping Estuaries
5 weeks · Design research · On-site Field Study · Lab: ODDE Research Center · Lab Project: Thresholds and Tapestries · Guidance: Dr. K.V. Gururaja & Dr. Deepta Sateesh.
How might we make complex socio-ecological relationships visible in ways that support better understanding and decision-making?
Panchagangavalli Estuary, Kundapura, Coastal Karnataka, India
Kundapura is a dynamic estuarine landscape shaped by the interaction of water, ecology, livelihoods, and infrastructure. Through field immersion, mapping, and qualitative research, this project explored how environmental systems and human practices are deeply interconnected, and how these relationships are changing over time.
Design Challenge
The challenge was not only to document environmental change, but to uncover the less visible connections between local practices, infrastructure, and ecological systems.
Process & Approach

01 Secondary Research
- Coastal ecologies
- Geography of Kundapura
- Movement research
- Contextual inquiry

02 Field Immersion
- Beaches & Estuaries
- Fishing ports
- Local markets

03 Documentation
- Visual data
- Audio recordings
- Field notes

04 Synthesis
- Journey mapping
- Systems mapping
- Relationship plots

05 Outcomes
- Conservation principles
- Infrastructure paths
- Future directions

Workshop
- Engaging in and with Aqueous Ecologies - Srishti Manipal Institute, India; Department of Landscape Architecture, Cornell University, USA; School of Architecture & Cities, University of Westminster, UK.
- Presented visual mappings and narratives of design research project.
Fieldwork & Documentation

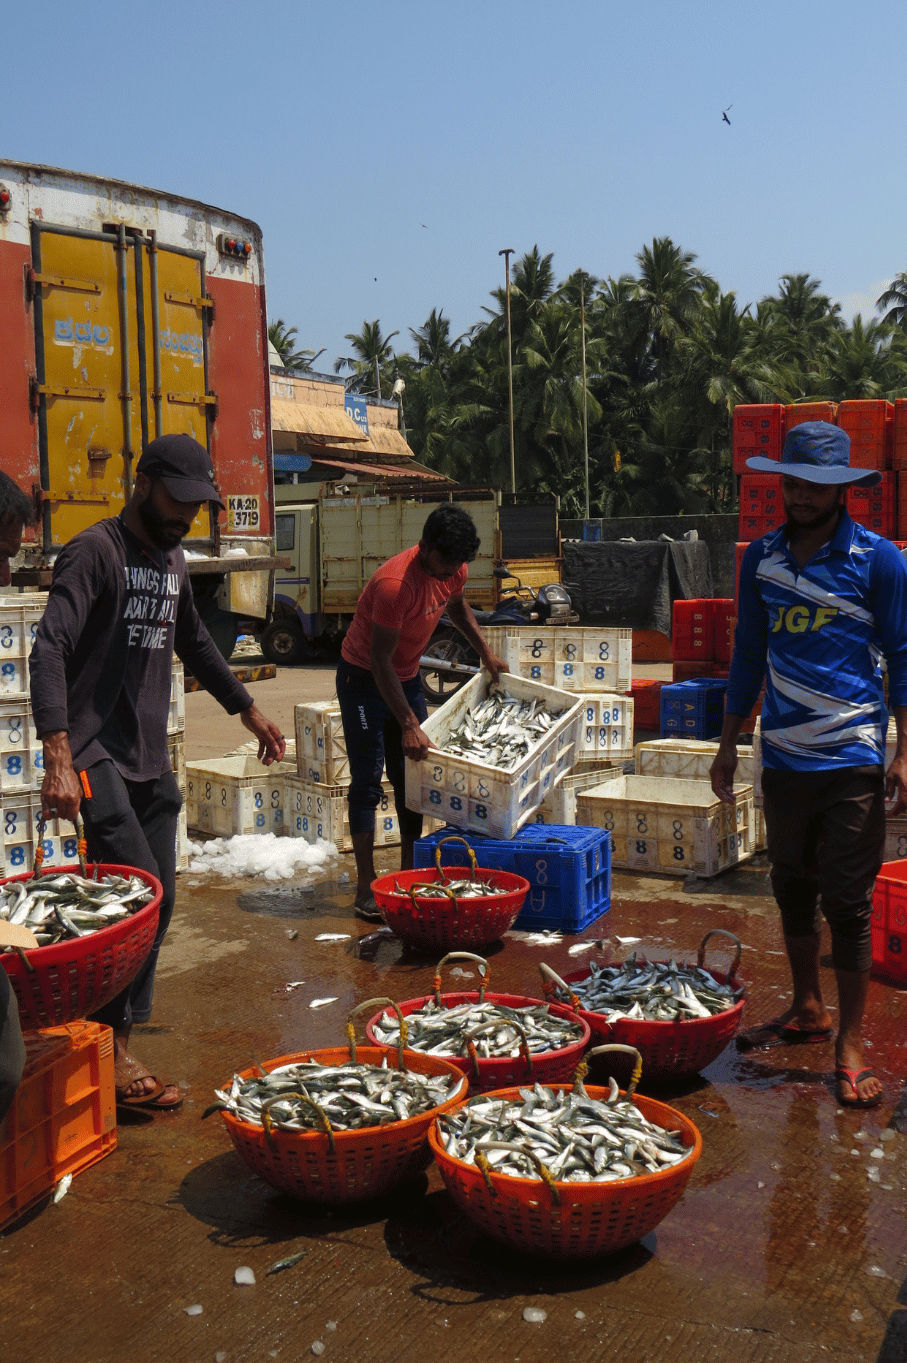


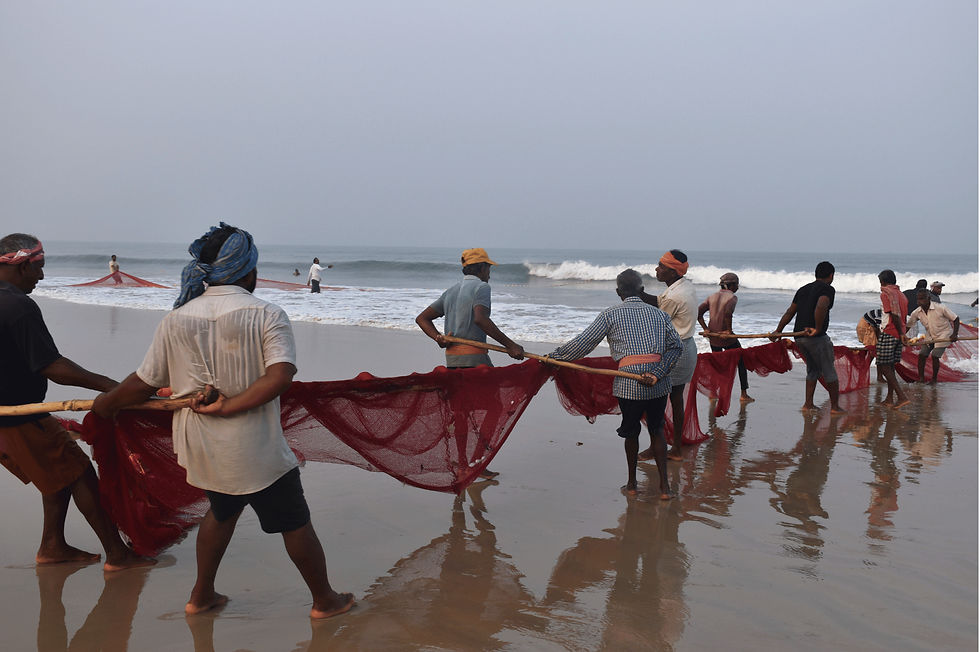
Our process began with thorough secondary research into coastal ecologies, followed by field involvement and contextual inquiry into regional practices and local livelihoods.
Key Insights
Fishing as Tradition
Fishing practices revealed knowledge systems, cultural traditions, and relationships with the environment developed over generations.
Infrastructure Impacts
Ports, sea walls, transport systems, and development projects influence both environmental conditions and local livelihoods.
Systemic Differences
The comparison between traditional and motorised fishing exposed differences in scale, labour, resource use, and relationships with the landscape.
Visualizing Complexity
Journey maps and visual plots helped reveal relationships that are often difficult to see through conventional documentation methods.
What I Designed
Journey of the Fish
A visual narrative and journey map tracing the movement of fish through estuaries, fishing practices, ports, markets, and communities.
The map was used as a tool to understand broader socio-ecological relationships and compare traditional and motorised fishing systems.
Systems Maps & Visual Plots
A series of visual mappings that documented ecological processes, movement patterns, cultural practices, and relationships across the Kundapura landscape.
Through engaging and immersing in Kundapura’s ecologies, it was observed, experienced, and comprehended, that various factors regarding the values of conservation are ingrained in local culture. This, along with the insights from the plots and design tools motivated us to come up with a set of principles and bring to light the rationale behind proposing these principles.

Visual Plot 1

Visual Plot 2
Reflection
Using the journey of fish as a lens helped make visible relationships that extended beyond fishing itself. The mappings revealed how livelihoods, infrastructure, ecology, labour, and community practices are deeply interconnected, demonstrating the value of visual mapping as a tool for understanding complex systems.